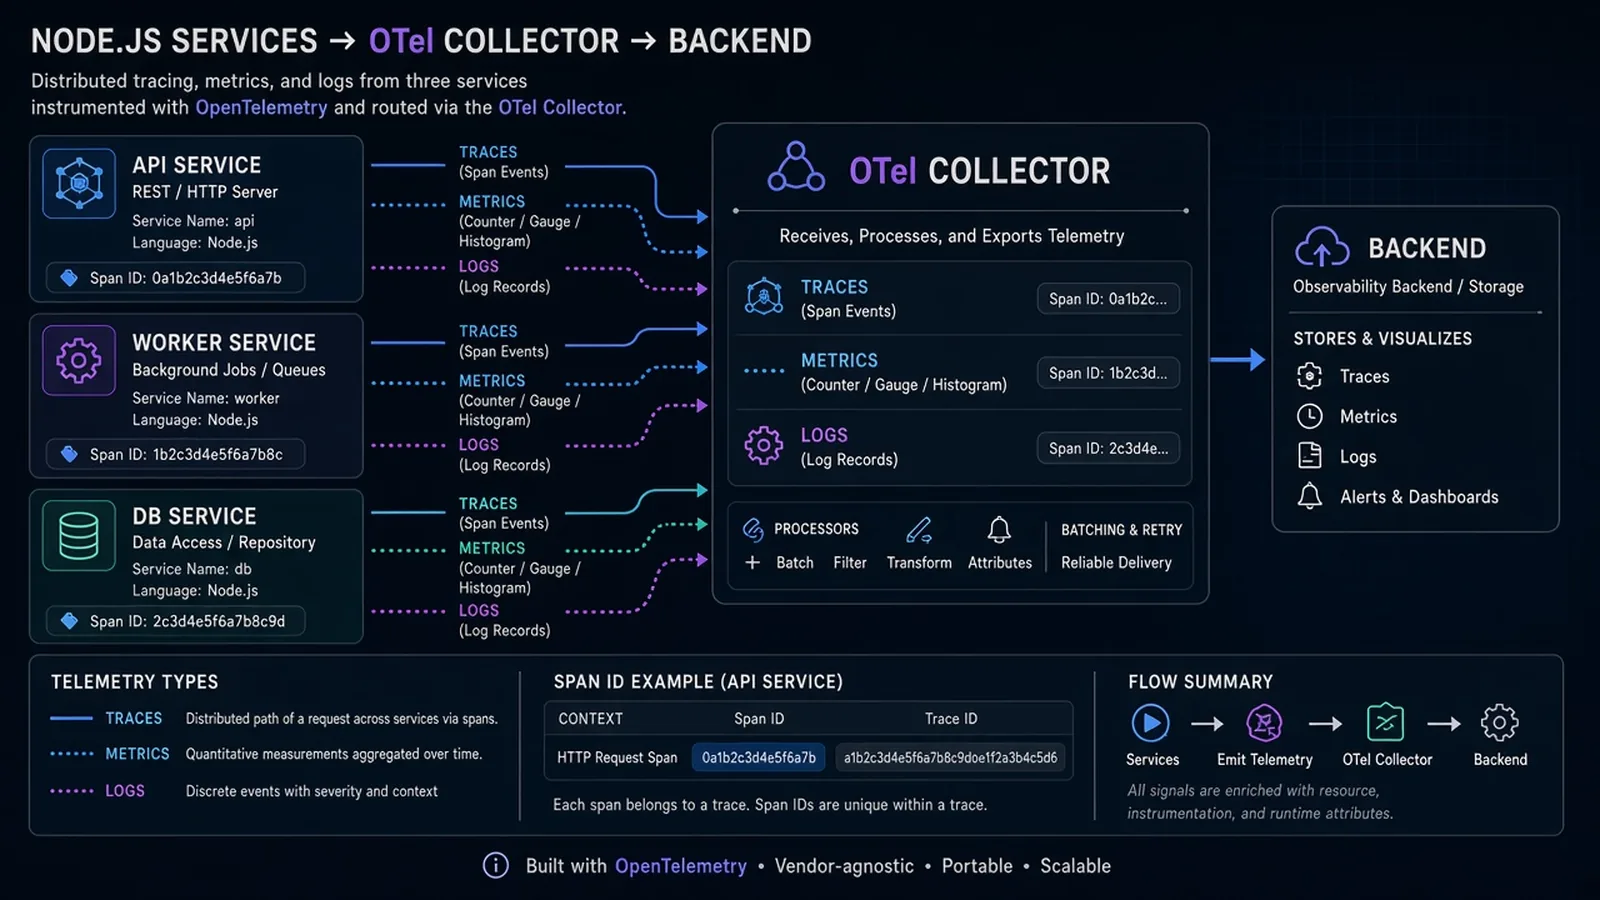
Production Node.js fails in ways console.log cannot explain: a slow downstream, a retry storm, a single tenant eating the event loop. Observability is the ability to ask "what happened for this request?" without SSH and folklore.
OpenTelemetry (OTel) is the vendor-neutral way to emit traces, metrics, and logs. You can change backends (Grafana, Honeycomb, Datadog, Jaeger, cloud APM) without rewriting instrumentation. This guide is the order we use on cloud and DevOps work - not a tour of every signal.
It pairs with a boring AWS baseline and CI that actually deploys. Dashboards without deploy hygiene are interior design.
Start With Traces, Not Twelve Dashboards
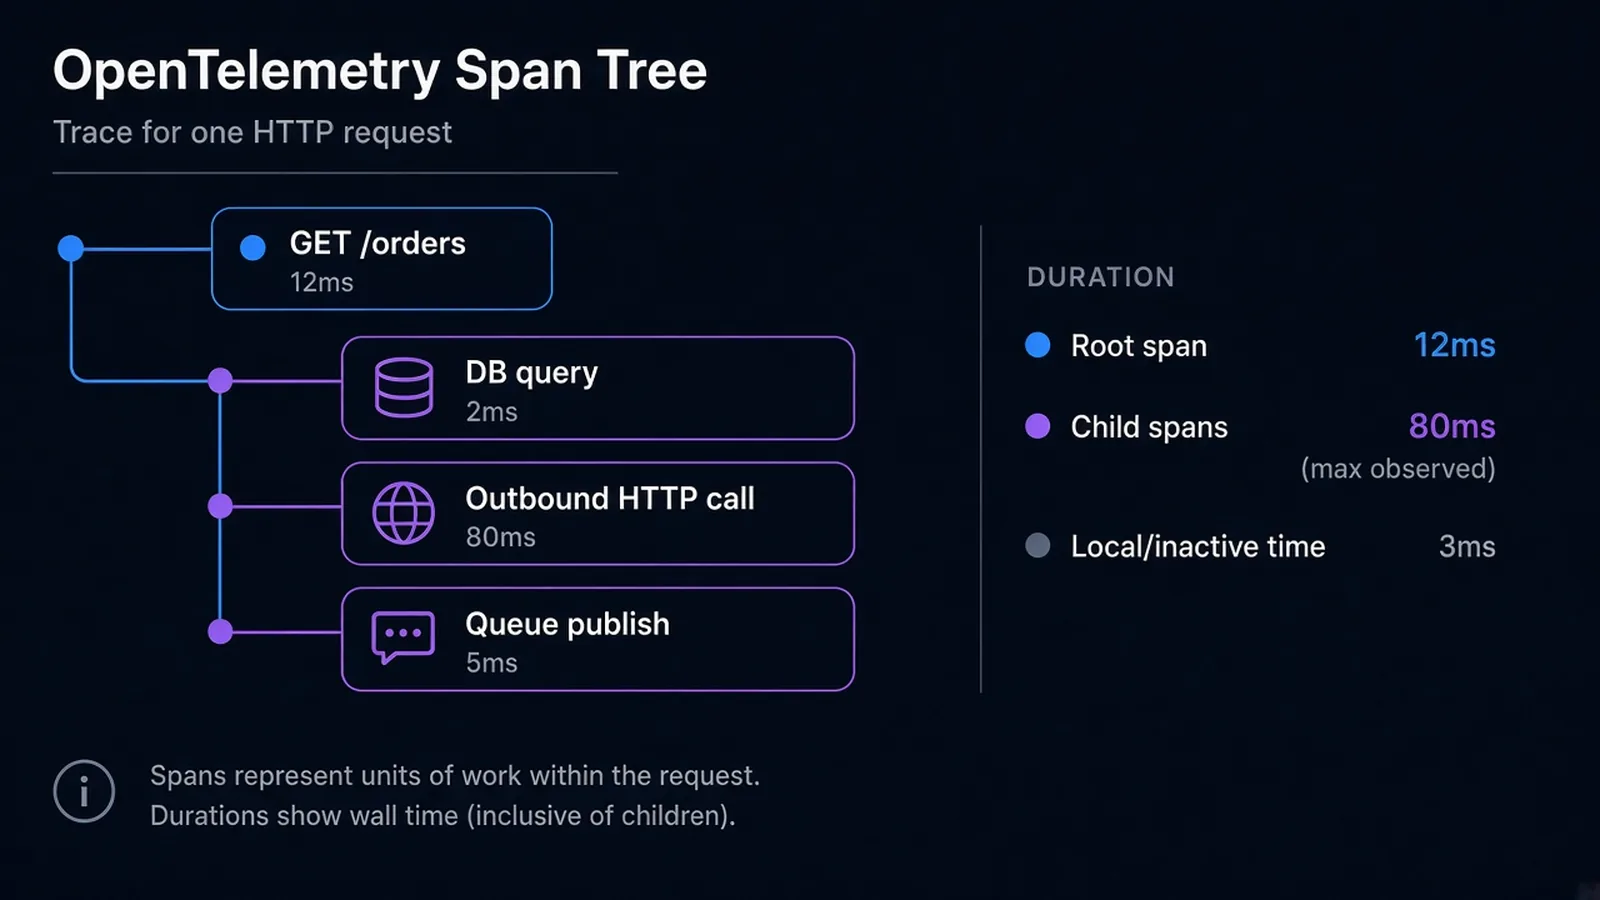
A trace is one request (or job) as a tree of spans: incoming HTTP, ORM query, outbound HTTP, queue publish.
On Node, auto-instrumentation covers a lot of HTTP and common libraries. That is enough to answer:
- Where did time go?
- Which dependency failed?
- Did this error cluster on one route, one customer, one version?
Metrics (request rate, latency histograms, queue depth) come second. Logs stay, but they should correlate via trace_id rather than being the only tool.
If you only have budget for one signal this quarter, ship traces plus error tracking. Golden-signal metrics without traces turn into "p95 is high" arguments with no next step.
A Minimal Node.js Shape
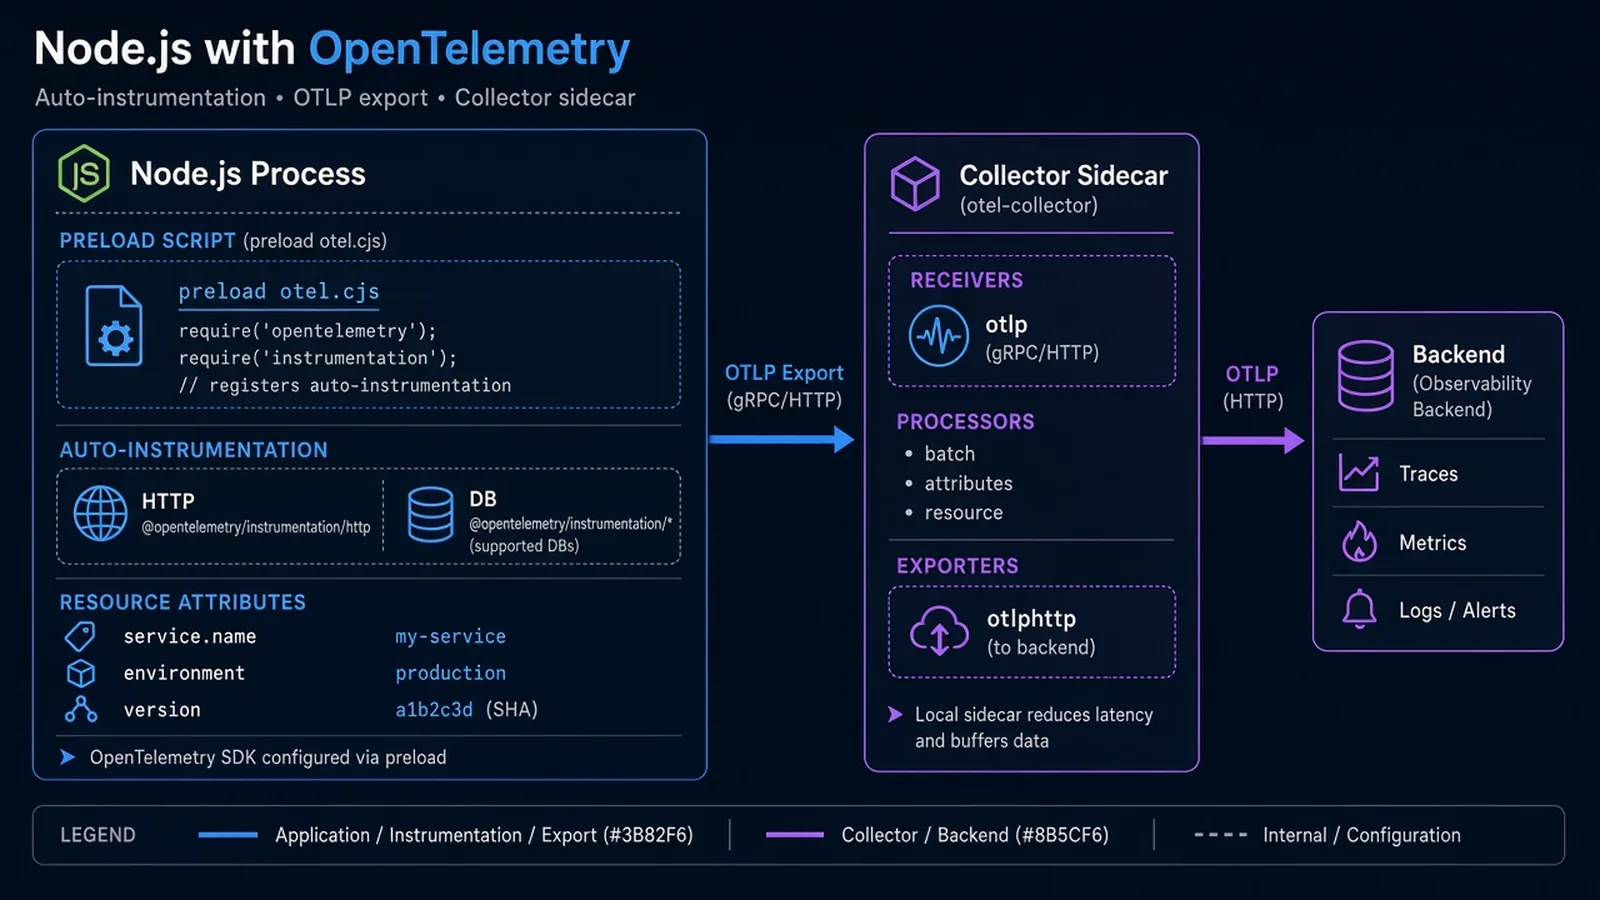
Keep instrumentation out of business logic as much as possible:
- Load the OpenTelemetry SDK before your app (
node --require ./otel.cjsor a preload in the container entrypoint). - Use the official Node SDK + auto-instrumentations for
http,express/fastify, and your DB driver. - Export via OTLP to a collector (sidecar or central), not directly to five vendors from the app.
- Set
service.name,deployment.environment, andservice.version(git SHA) as resource attributes. Version is how you tell "bad deploy" from "bad dependency."
Do not sprinkle tracer.startSpan on every function. Add manual spans where auto-instrumentation is blind: queue consumers, cron, LLM calls, multi-step workflows.
For AI features, a span around retrieval + model + tool calls is how you debug latency and cost together. That is the operational half of shipping Production AI; token economics are covered separately in LLM API cost optimization.
Sampling: The Bill and the Blind Spot
Always-on 100% traces is fine at low traffic. It is a surprise invoice at scale, and a storage problem before that.
Practical default:
- Head sampling at 5-15% for healthy traffic
- Always sample errors, slow requests (e.g. >2s), and a denylist/allowlist of critical routes (
/checkout,/webhooks/stripe) - Tail sampling in a collector if you can afford the extra hop - keep error traces even when the parent was sampled out, if your pipeline supports it
Sampling is a product decision: what questions must you still answer at 10× traffic?
What to Instrument First
| Surface | Why |
|---|---|
| Incoming HTTP / queue consumer | The root span - your "what was the user doing?" |
| DB queries | N+1 and missing indexes show up here immediately |
| Outbound HTTP | Timeouts, 429s, and vendor blips (rate limits belong in traces too) |
| Auth boundary | Failed auth vs downstream 500s are different incidents |
| Background jobs | Otherwise they are invisible until a queue explodes |
Add custom attributes sparingly: tenant.id, user.id only if your privacy policy allows, route (templated, not raw URLs with IDs), feature_flag. High-cardinality labels (email, full URL) will wreck metric backends and leak PII.
Logs, Metrics, and the Collector
Logs: structured JSON (level, msg, trace_id, span_id). Uncorrelated logs are a haystack.
Metrics: RED (rate, errors, duration) per route; process metrics (event loop lag, heap) for Node specifically; queue depth for workers. Histograms, not just averages.
Collector: run the OpenTelemetry Collector as the fan-in point. Apps speak OTLP. The collector batches, tailsamples, and exports. That is also where you strip attributes you should not send to a SaaS.
Kubernetes is optional. A single Node service on ECS or a VM can run the SDK + collector sidecar. Do not wait for Kubernetes to start tracing.
Node-Specific Traps
- Loading OTel too late. If
expressis imported before the SDK, you miss incoming spans. Preload is not optional. - Bundlers. Server bundles can tree-shake instrumentation. Keep the SDK in the Node runtime, not in a browser bundle.
- Serverless. Lambda/Cloud Run cold starts plus batch exporters can drop spans on freeze. Use the vendor's recommended exporter settings; flush on freeze/shutdown.
- Event loop. A blocked loop looks like "everything is slow." Process metrics + traces together tell you CPU vs wait.
- PII in spans. Authorization headers, SQL with literals, and prompt text do not belong in a vendor by default. Redact.
What "Good" Looks Like in an Incident
You should be able to:
- Open the error (or the slow trace) from the alert
- See the version that served it
- See the downstream that failed or the query that dominated
- Jump to related logs for that
trace_id - Tell whether it is one tenant or everyone
If on-call still starts with "tail the box," the dashboard is not observability yet.
Cost and Ownership
APM bills follow cardinality and volume. Ownership follows the service: the team that ships the route owns its traces. A central platform team can run the collector and defaults; they should not be the only people who know what a span means.
For a startup, a hosted backend plus auto-instrumentation is enough. For a multi-service shop, invest in naming conventions (http.route, rpc.method) so traces compose.
The Bottom Line
OpenTelemetry on Node.js is: preload the SDK, auto-instrument HTTP and data stores, export OTLP, sample on purpose, and put trace_id on logs. Manual spans belong on jobs and AI/tool flows. Everything else is vendor preference.
Ship traces before you buy a wall of unused charts. Then make "open the trace" the default incident move.
Need traces, alerts, and a cloud baseline that on-call can actually use? See Myrafy cloud & DevOps or get a free estimate.